Passive filter
A filter dampens a specified range of signal frequencies. For example, to remove high frequency noise you use a low-pass filter. The simplest filter is an RC circuit (see Figure 1).
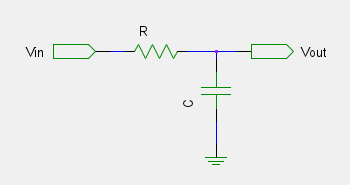
This filter removes frequencies above  , known as the cut-off frequency, at a rate of -6dB/oct.
It also delays the signal by φ=-atan(ω/ω0).
An example
Let C = 47μF and R = 10Ω. The cut-off frequency is 339Hz (or 2128rad/s). The filter will remove frequencies above this. A Python script was written to return the amplitude and phase response.
def low_pass_response(v0, w, R, C):
    w0 = 1.0/(R*C)
    a = w/w0
    phi = -atan(a)
    v1 = v0*(1.0/(1.0 + a**2.0))**0.5

    return v1, phi
The response of this filter to an input of 1V at 50Hz is shown in Figure 2.

Note that while the cut-off frequency is far above the input frequency, there is still an amplitude and lag effect on the signal.
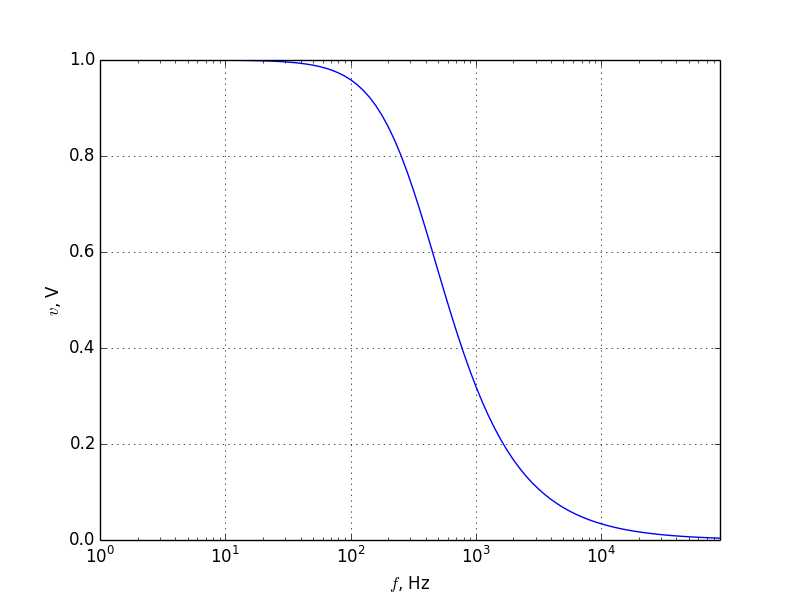
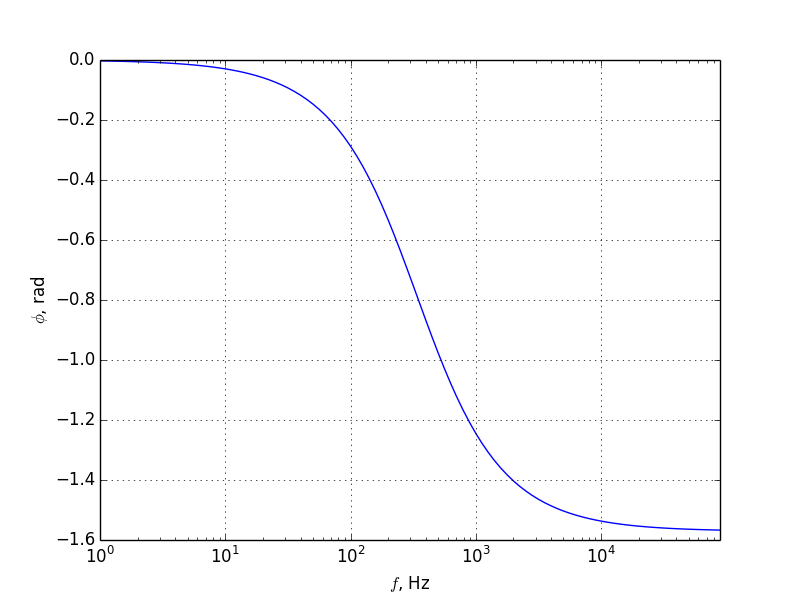
Calling the same function with a range of frequencies provided the amplitude and phase response of this filter (see Figure 3).
White noise
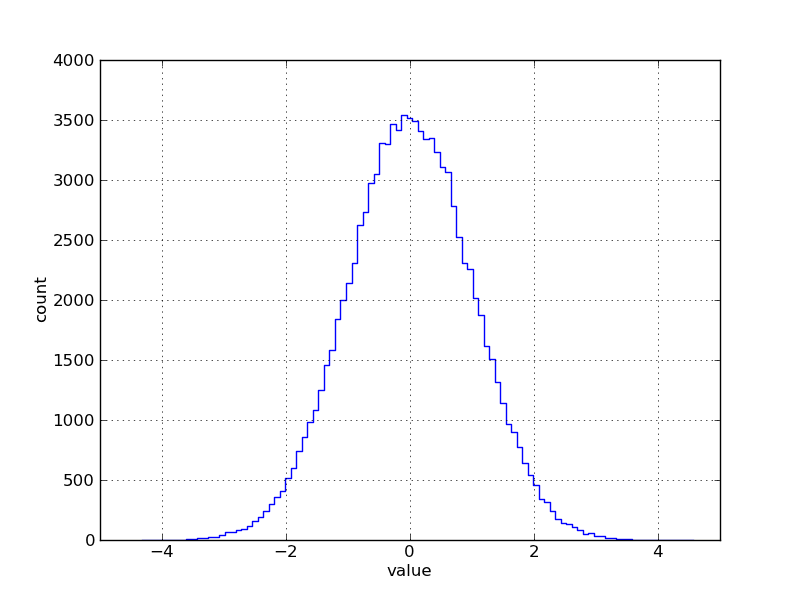
White noise is a normal distribution of values (in this case, voltages), with mean of 0 and standard deviation of 1.
import numpy

def whitenoise(n=1, v0=0.01):
    # white noise has a mean of zero and a std of 1
    mu, sigma = 0, 1
    return v0 * numpy.random.normal(mu,sigma,n)
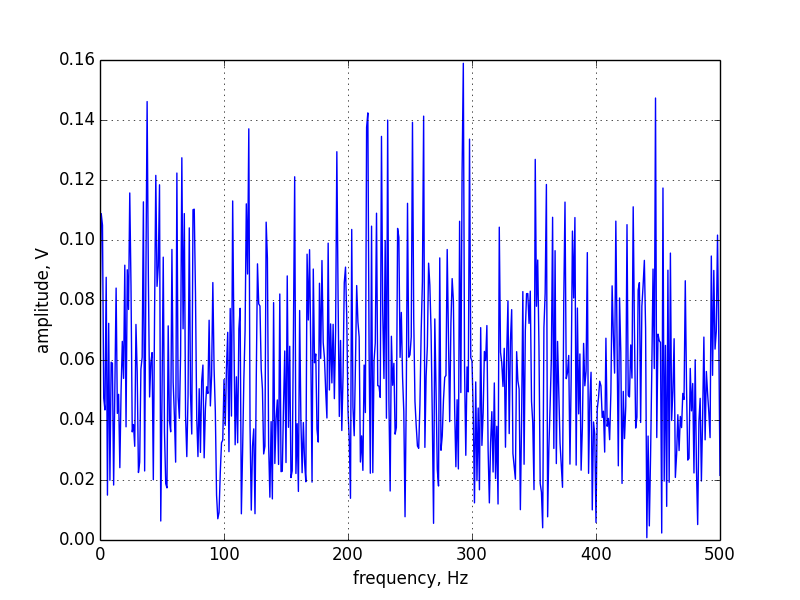
A histogram and frequency plots of whitenoise are shown in Figure 4.
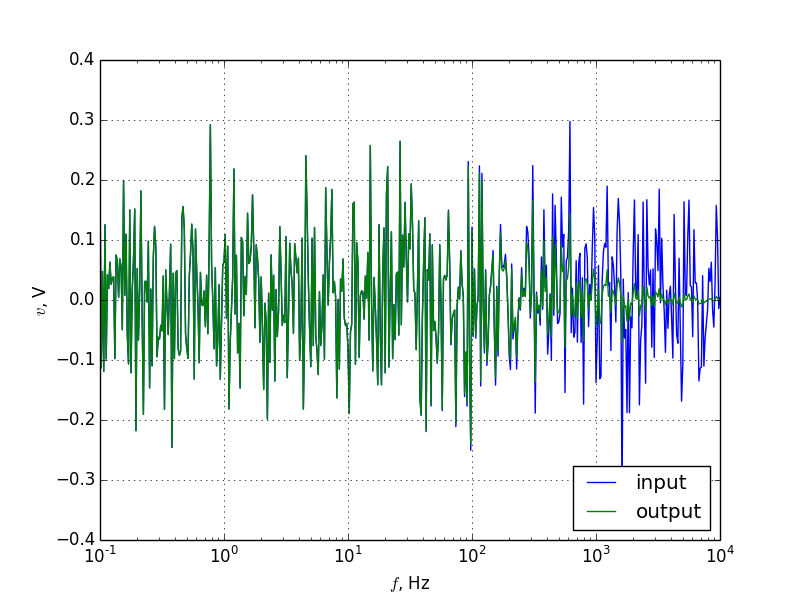
White noise voltages are evenly spread over all frequencies. This is what we will to change with the filter.To filter this noise, pass each voltage in the array to low_pass_response (see Figure 5).
Noisy input voltage
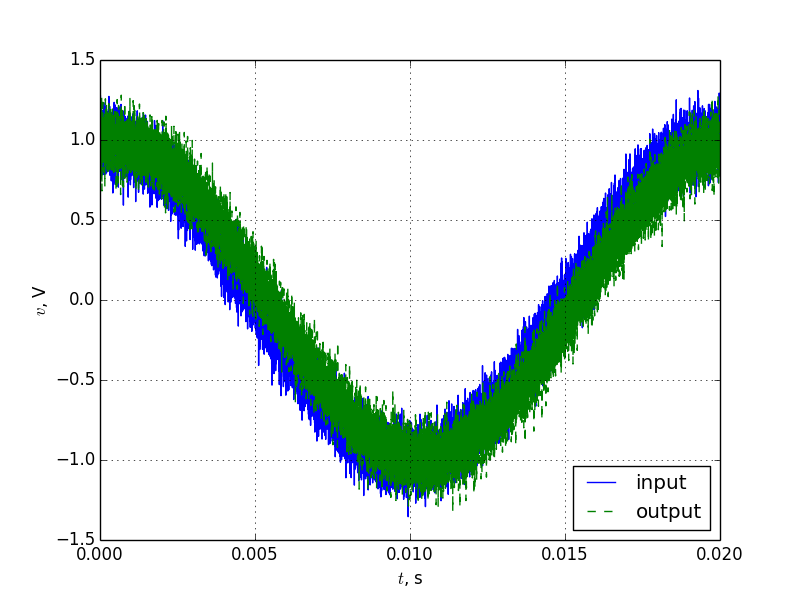
Adding white noise to the input voltage results in Figure 6.
The filter removes all voltages above the cut-off frequency, so it helps to know what frequencies you are interested in, to prevent removing the data as well as the noise. Just like here, data can be filtered using a circuit or by post-processing. Which approach you use will depend on your application.
